A four-point scale, no middle option
No “neither agree nor disagree” to hide in: everyone commits.
Measure workplace climate and job satisfaction by segment.
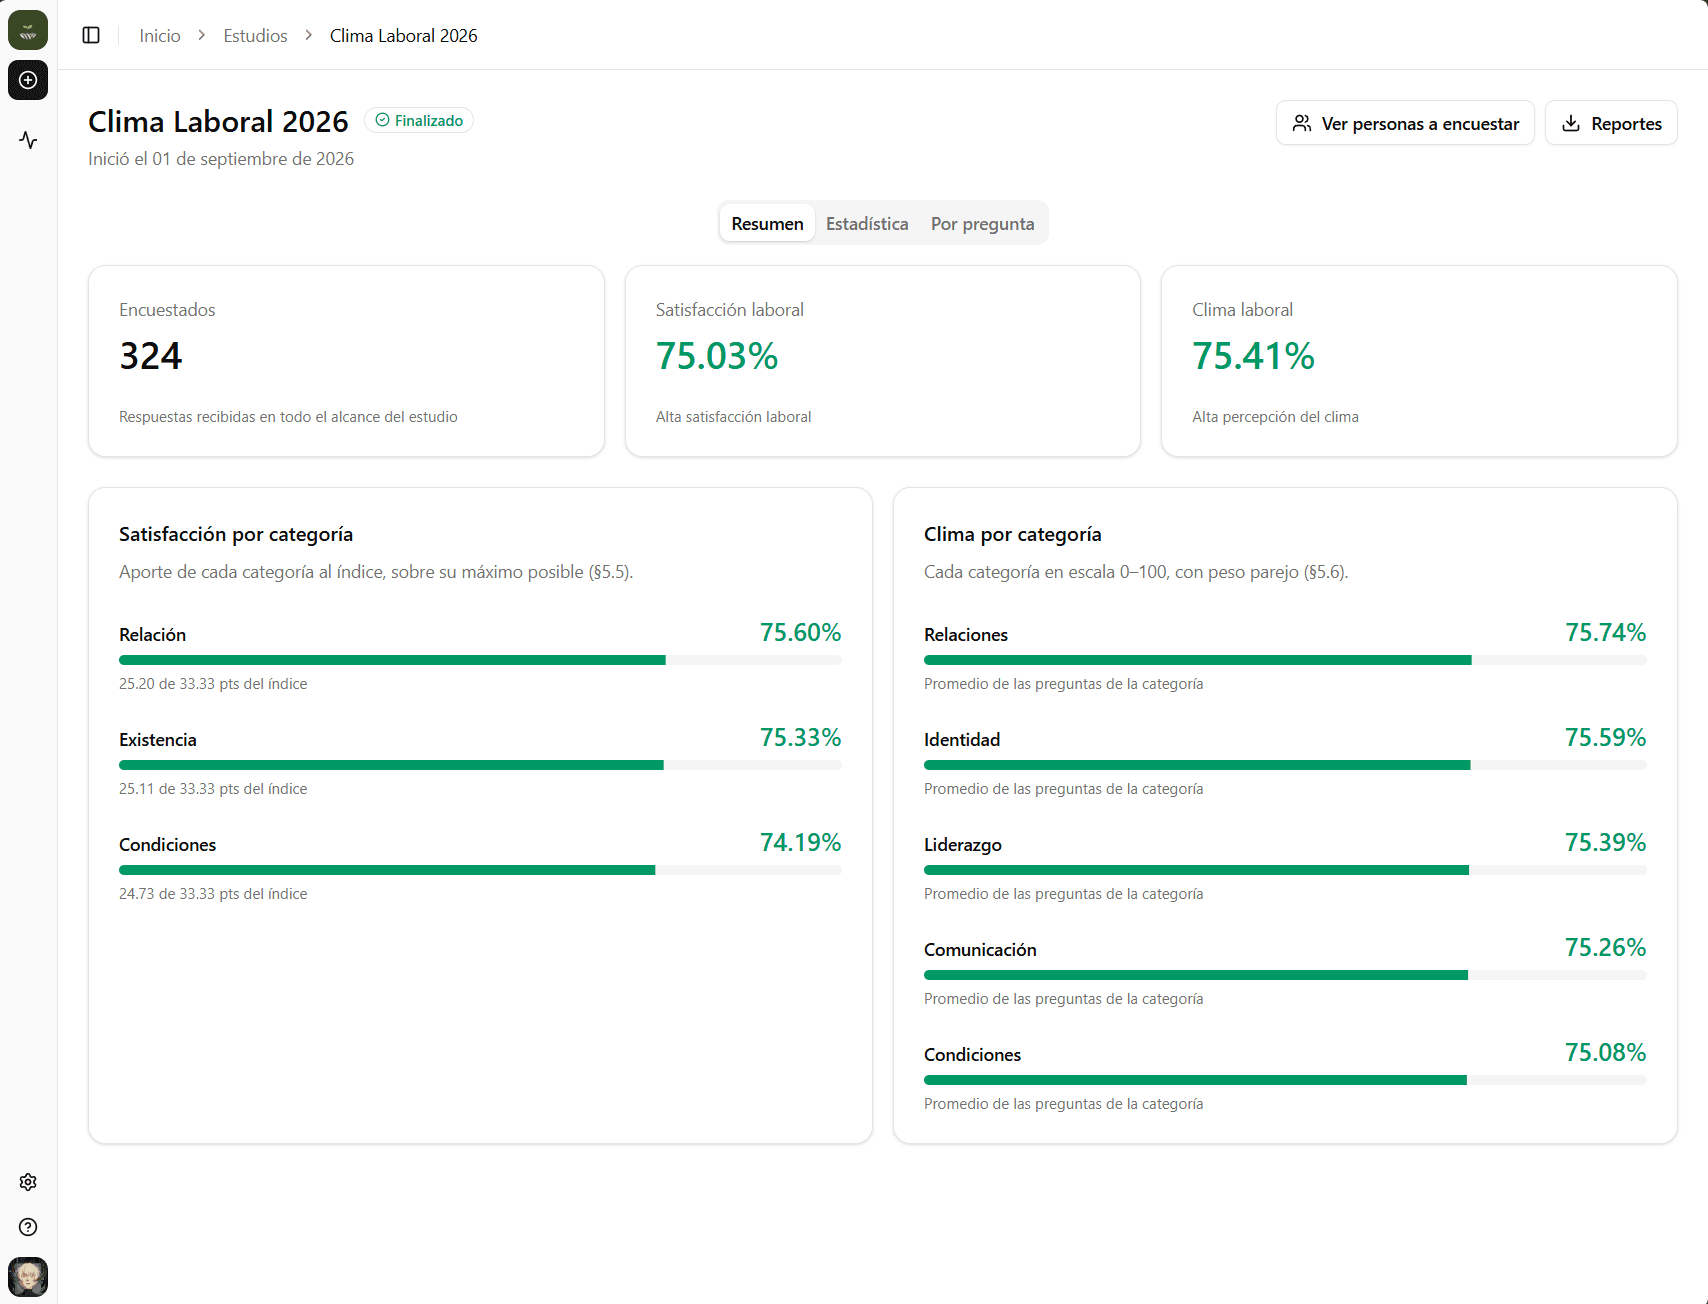
Most climate and job-satisfaction surveys end up as a file that can't be compared against anything. Here every answer adds up to a number, and that number rests on a model.
No “neither agree nor disagree” to hide in: everyone commits.
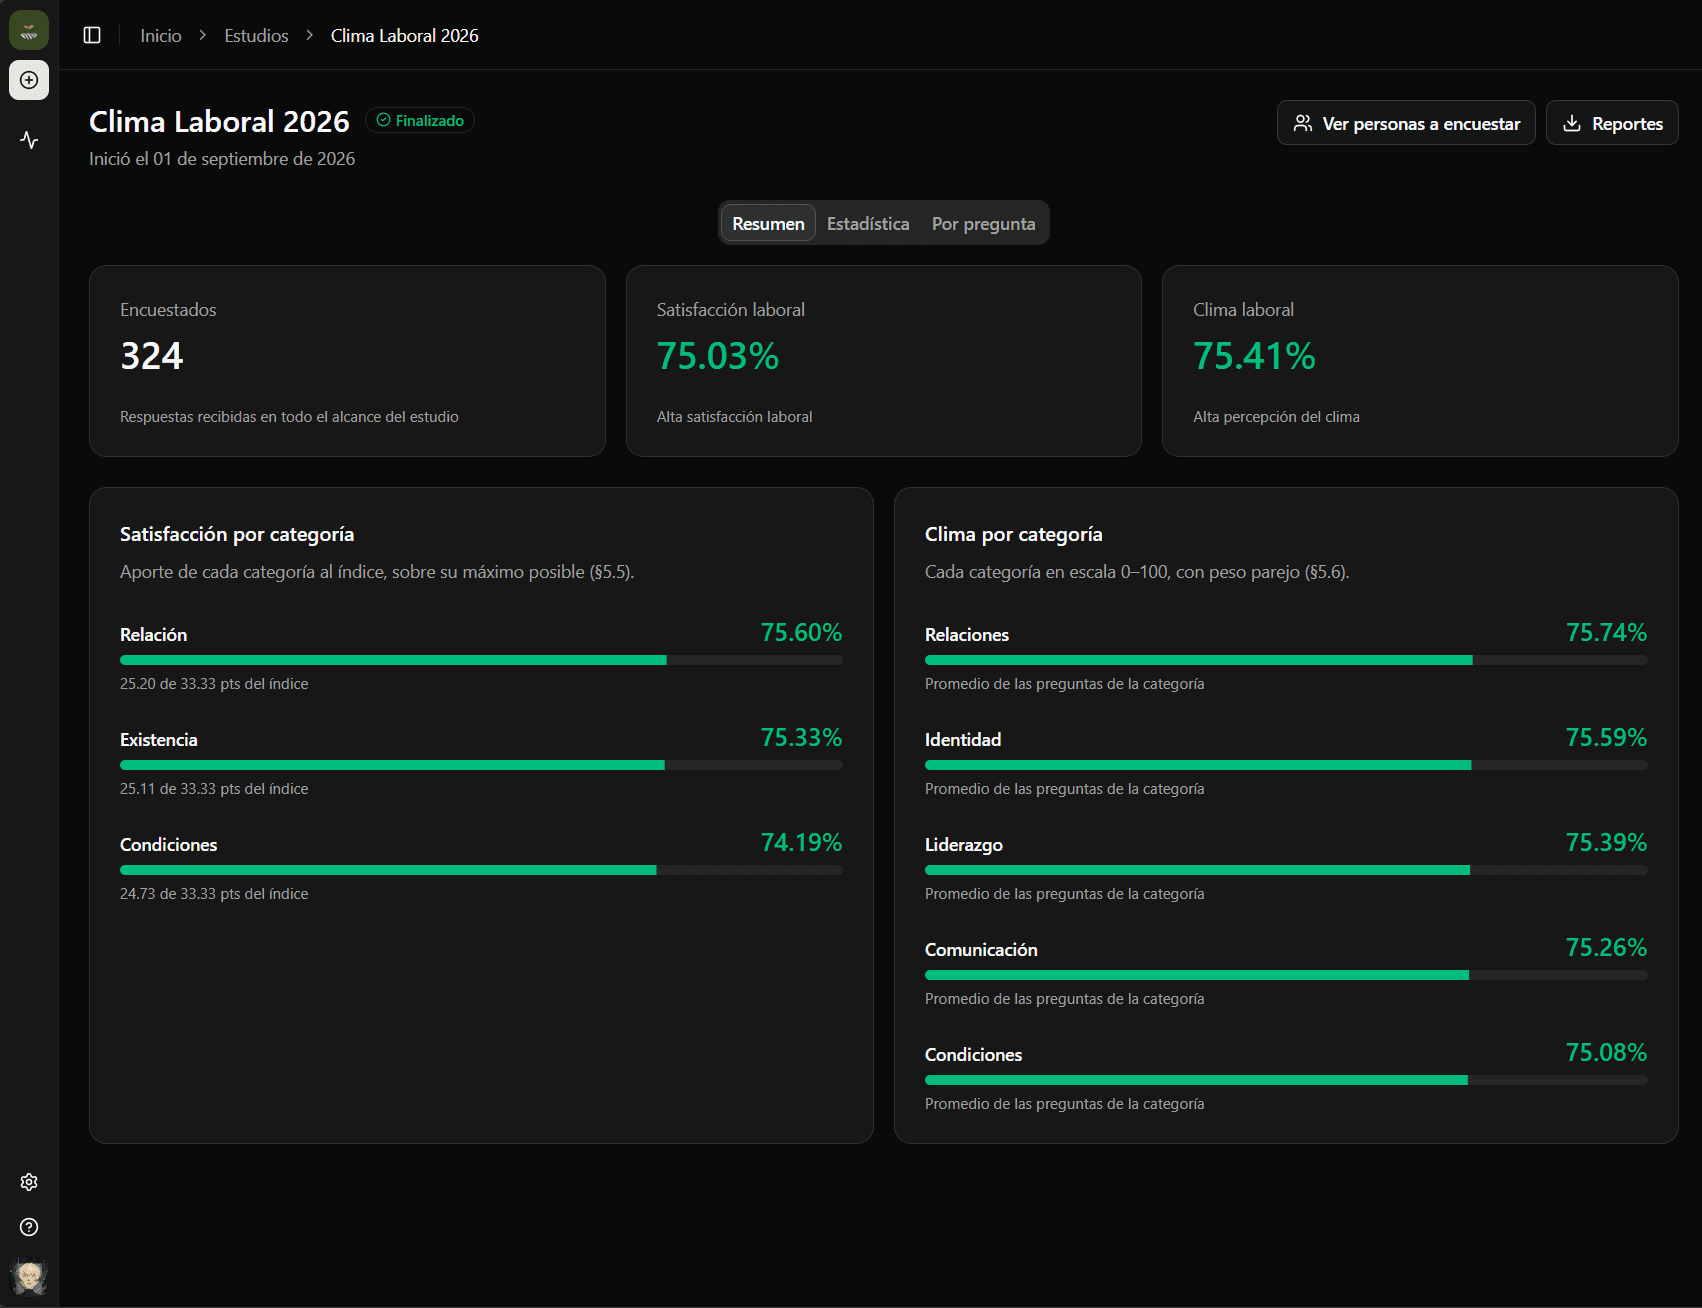
There isn't one model: there are several, and each one gives a number you can compare.
With the breakdown you chose. Nothing to rebuild in Excel before the meeting.
Inside the result
You don't adapt to our system: the system adapts to your company. Company, branches, departments, and areas, however they are set up today. Open a branch tomorrow and you just add it — the history of what you already measured stays intact.
You build your company tree: branches, departments and areas, however they stand today.
The system hands you a template of the tree you just built. You fill it in with your people and upload it.
Pick whether to measure one department or the whole company. Each questionnaire assembles itself: the model's questions plus the ones you added.
They arrive split by segment. Compare areas and see where to act, not just the overall number.
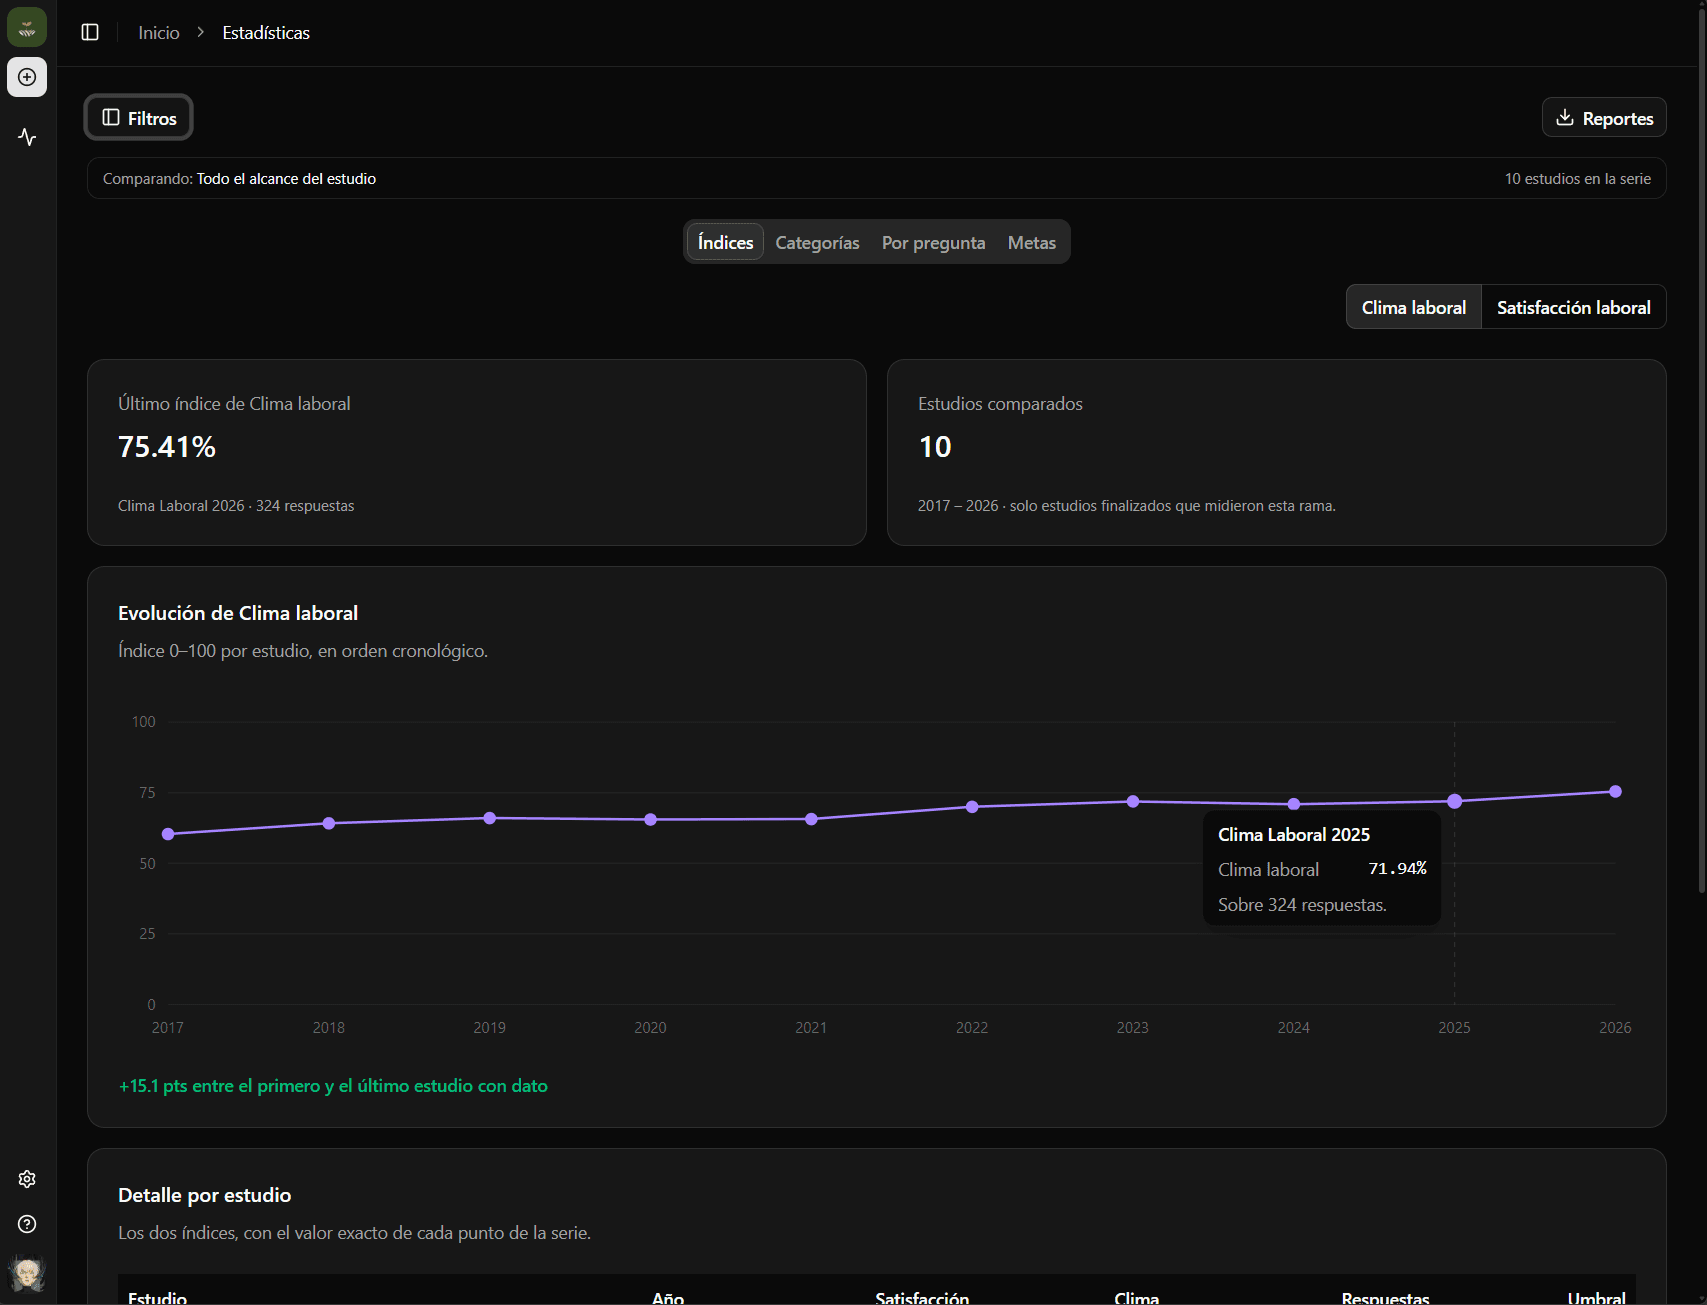
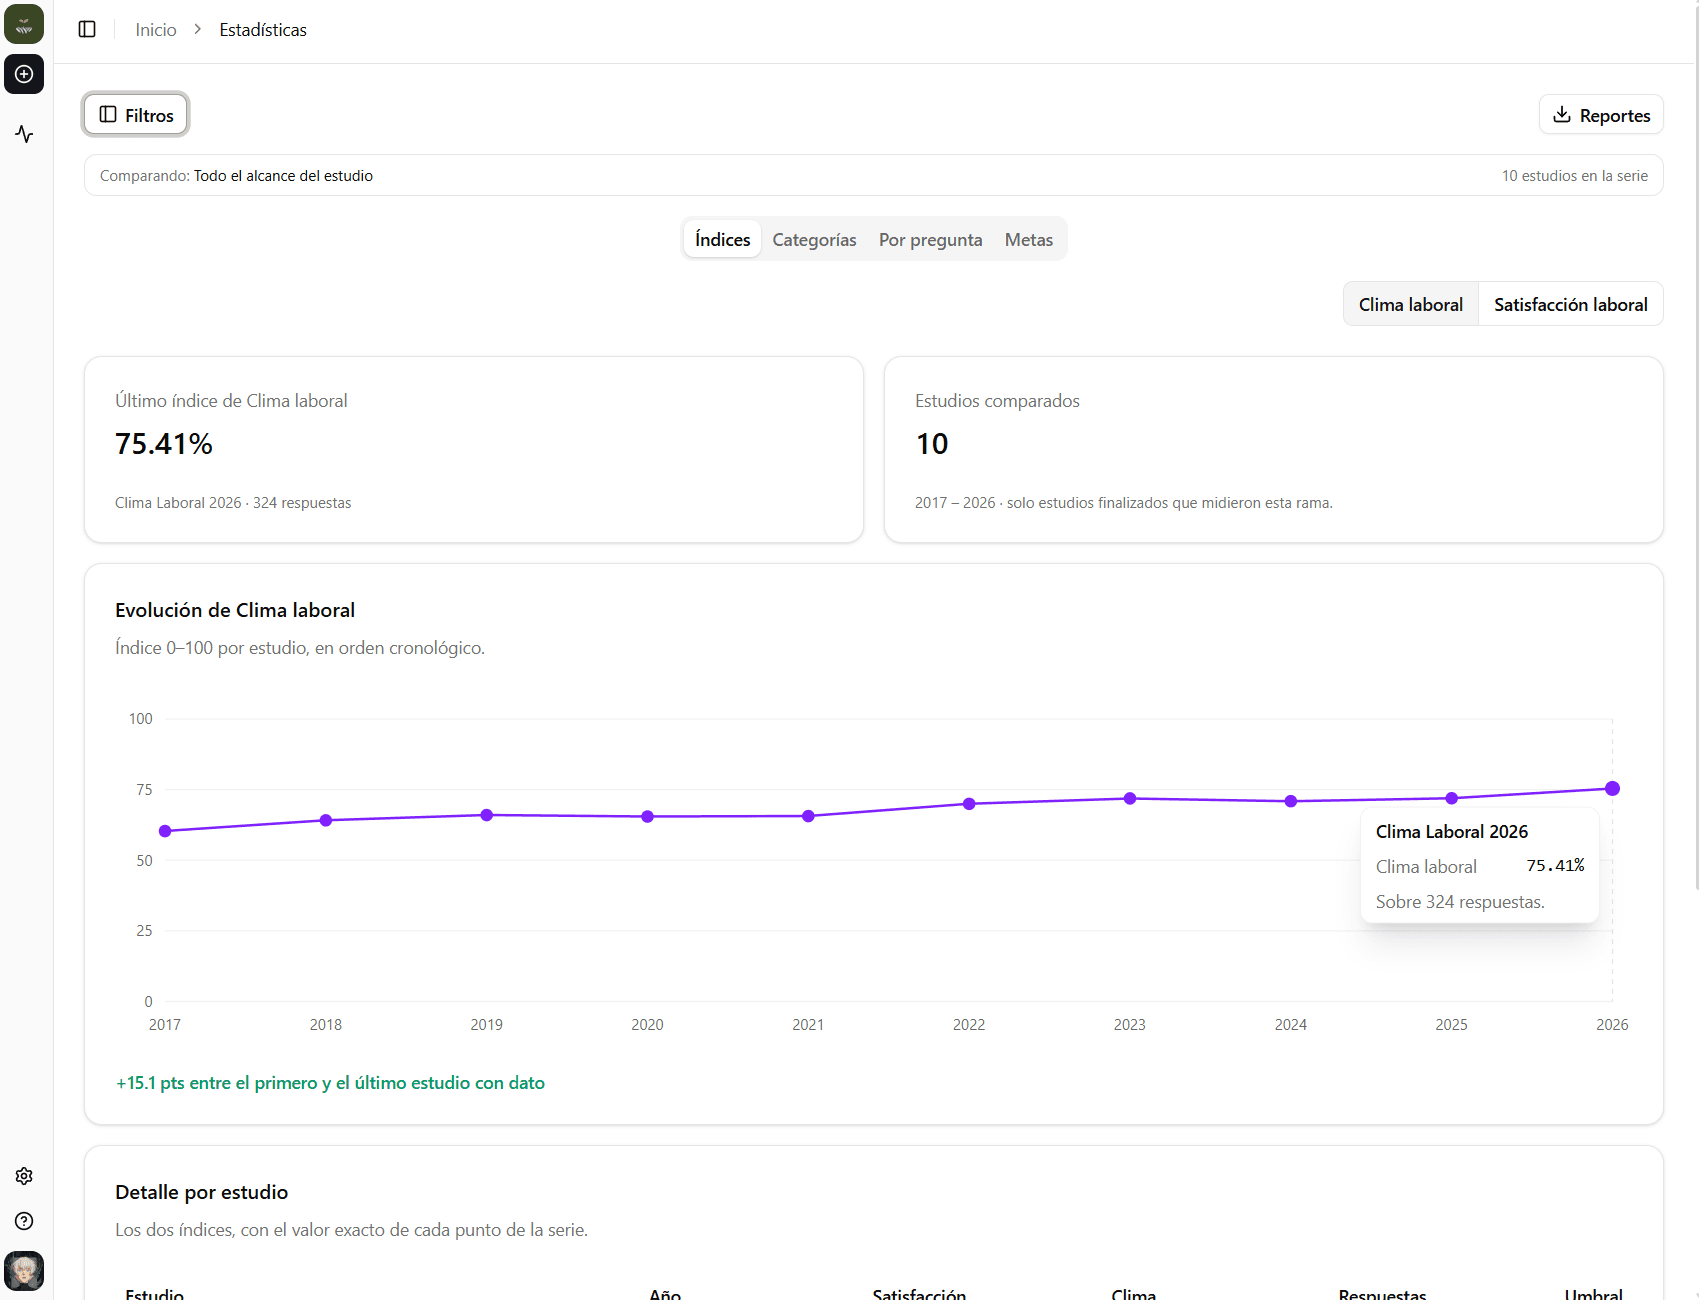
Analysis isn't a bigger average. It's being able to ask your data specific questions and get an answer.
North region, night shift and over five years, all at once. You stop arguing about averages and see the exact group you care about.
One area against another, or against its own past. Nobody gets to tell you the comparison wasn't fair.
If a cross-section is left with too few responses, the system says so. You don't decide on a number that can't hold.
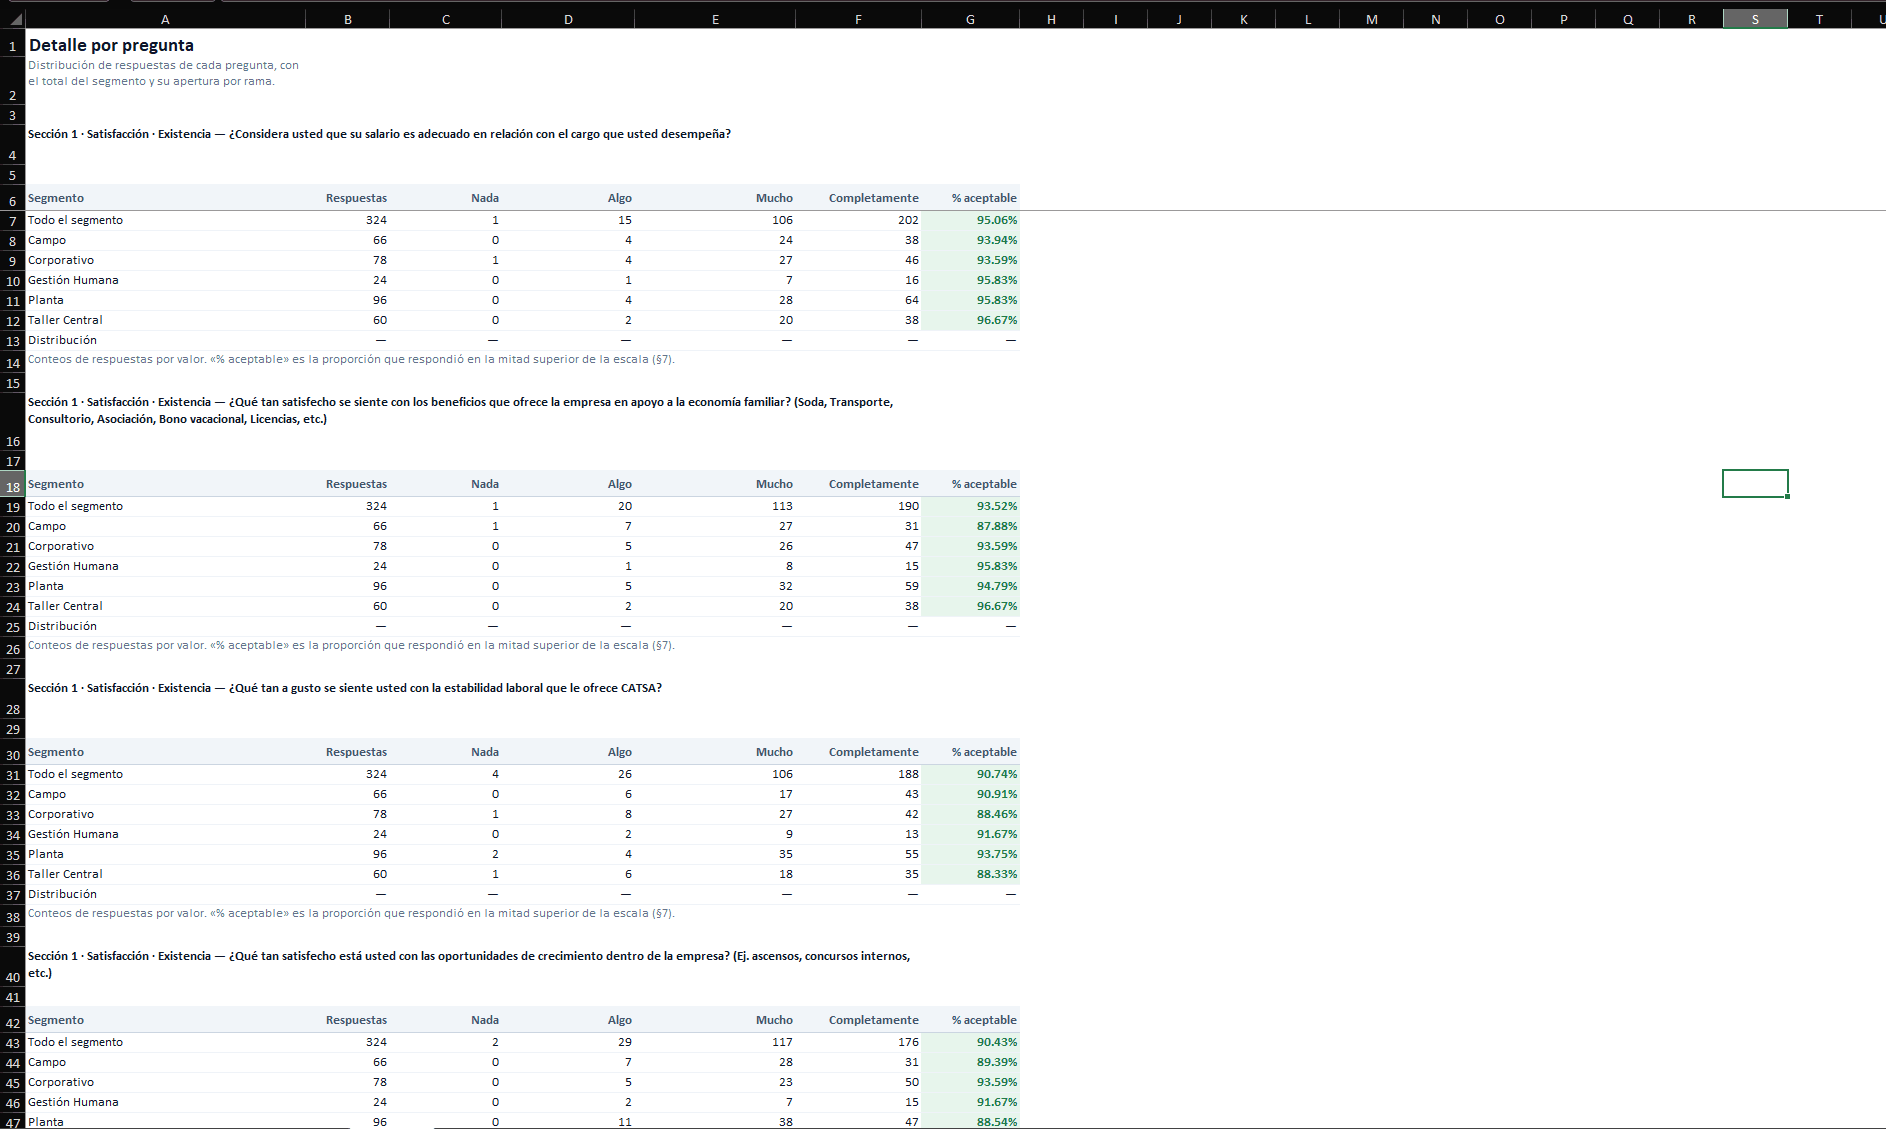
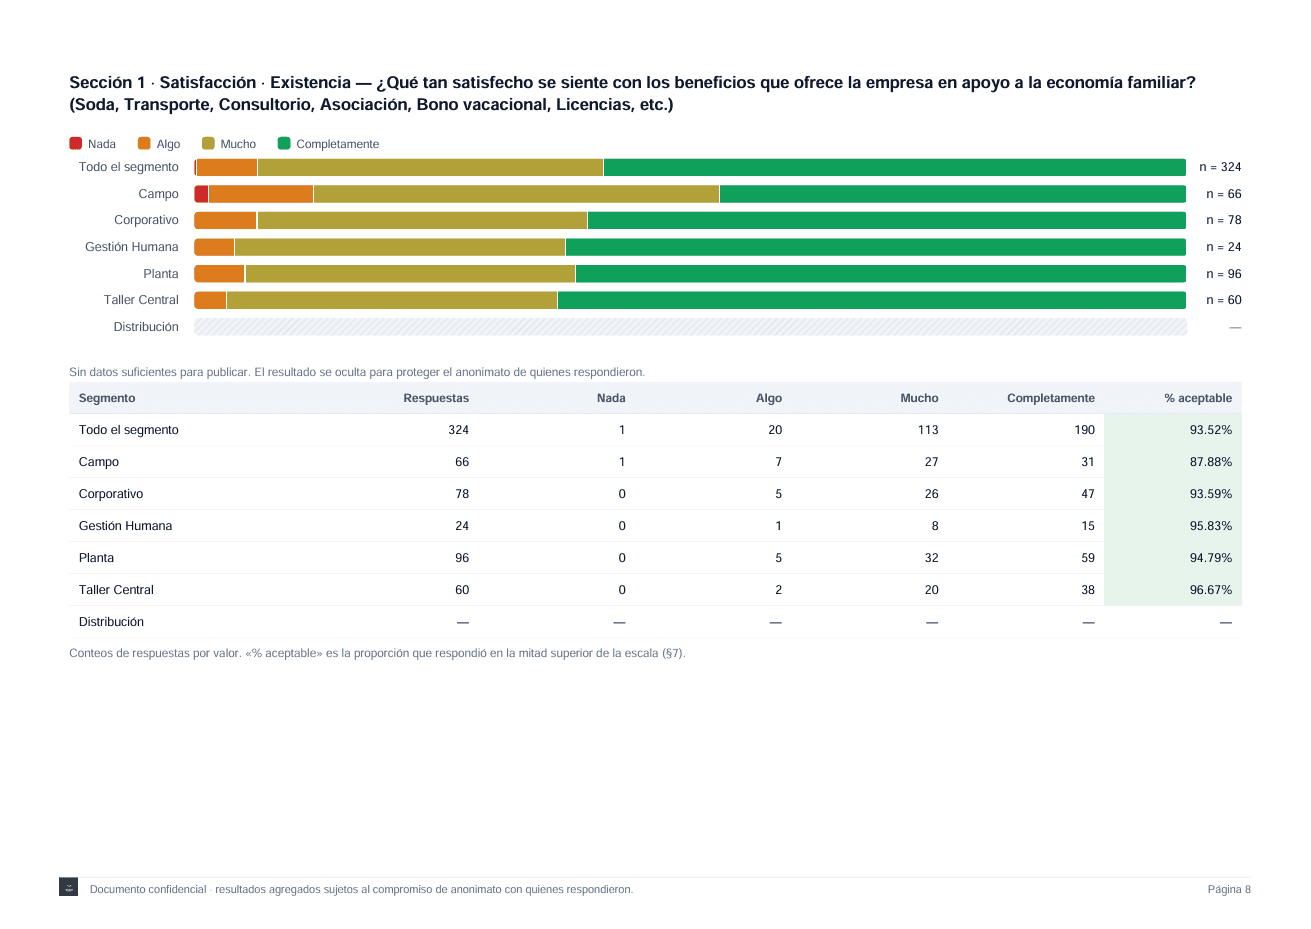
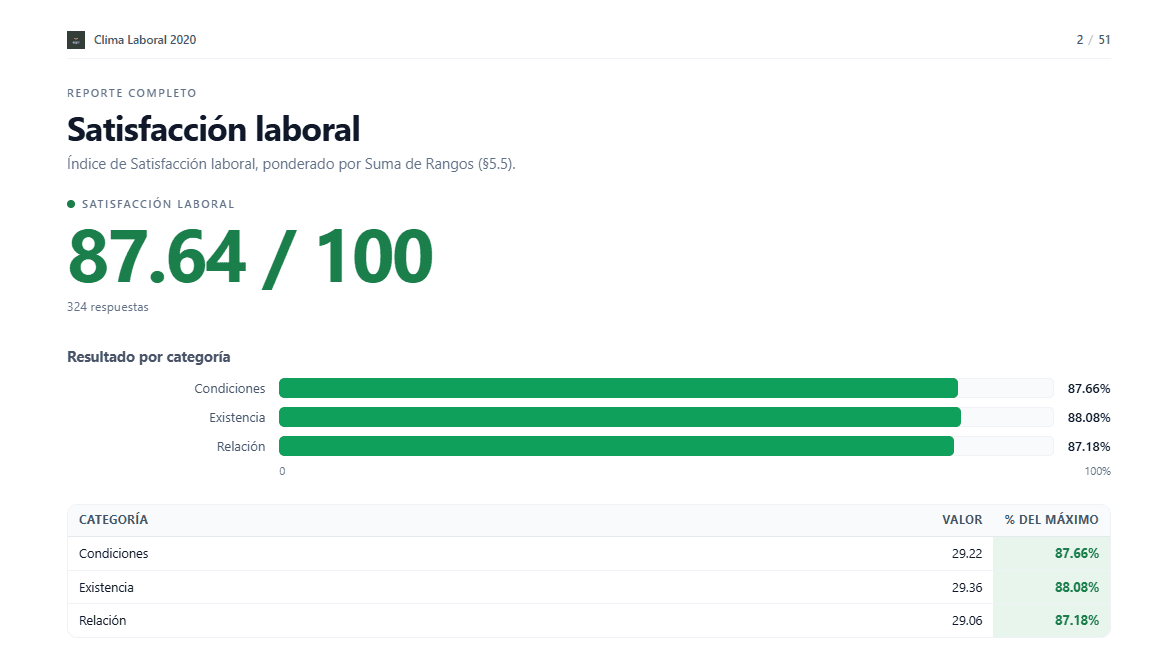
The report comes out with the cross-sections you built: the filters applied, the result for each segment and the comparisons. Download it as XLSX, PDF or HTML, depending on what you'll do with it.
The full table, to keep slicing it in your spreadsheet.
The finished report, ready to print or present to leadership.
The report as a page, with the charts and the filters you applied.
The questions that come up before launching a first study, answered straight.
No. Responses are detached from identity: tokens are issued per segment, never per name. People answer honestly only when they know they can't be identified, and that isn't a promise — it's how the system is built.
No segment shows results below the minimum number of responses you set. That minimum applies when filters are combined too, which is exactly where groups shrink without anyone noticing.
A universal core everyone answers the same way, plus the questions you add attached to a branch of your organization. The scale has four options and no middle point: everyone commits.
Yes, as long as the question core and the scale are the same. That is why the core does not change between studies: it is what lets two results sit on the same line.
The system gives you a template of your company tree. You fill in the roster and upload it in the roster section. Then you pick who to measure and launch the study. There is no implementation project.
Yes. When you hire us, training is included from the start: how to build the roster, launch the study, and read results by segment.
No. You create the account and start.
Create your account, upload your roster, and measure. Training is included when you hire us.